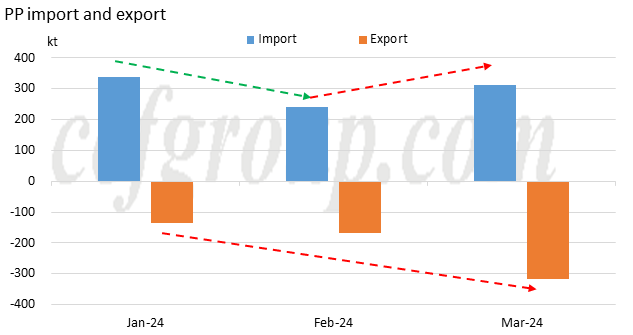
According to the China Customs, in March 2024, the total import volume of PP was approximately 310,677 tons, a decrease of 9.22% compared to the previous year. Of all imports, homo PP imports accounted 214kt, down 8.35% compared to the same period of last year; co PP 81.4kt, down 14.21% year-on-year; ra co PP for 15.2kt, up 10.28% year-on-year.
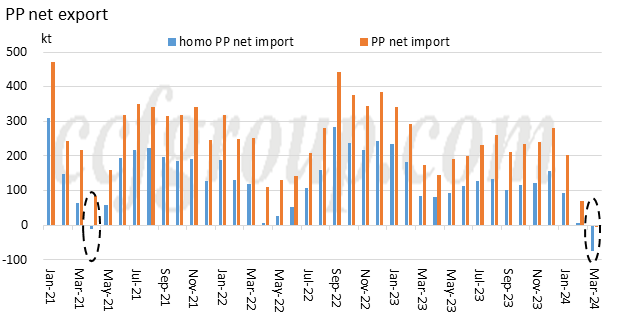
The total export volume of PP in Mar 2024 was about 315.5kt, a year-on-year increase of 87.84%; among which the export of homo PP was about 289.3kt, a year-on-year increase of 94.13%. In March 2024, homo PP achieved a net export of 75,300 tons, with a total net export of PP amounting to 4,800 tons.
PP import & export in March | |||||
Products | homo PP | co PP | ra PP | total | |
HS Code | 39021000 | 39023010 | 39023090 | ||
import | quantity(kt) | 214 | 81.4 | 15.2 | 310.7 |
y-o-y change | -8.35% | -14.21% | 10.28% | -9.22% | |
m-o-m change | 33.26% | 17.31% | 67.45% | 29.93% | |
export | quantity(kt) | 289.3 | 23.1 | 3.1 | 315.5 |
y-o-y change | 94.13% | 39.01% | 32.86% | 87.84% | |
m-o-m change | 88.41% | 77.67% | 39.85% | 86.95% | |
net import | quantity(kt) | -75.3 | 58.3 | 12.2 | -4.8 |
y-o-y change | / | -25.49% | 5.77% | / | |
m-o-m change | / | 3.41% | 76.17% | / | |

Looking back in history, homo PP achieved a net export for the first time since April 2021 (the second time in history), with a significant difference (around 11,200 tons of net export in April 2021). It is also the first time in history that the total PP amount achieved a net export. With the continuous rapid expansion of domestic PP production capacity, the overcapacity is gradually becoming more apparent.

From the perspective of first-quarter data, the import volume of PP decreased initially and then increased, while the export volume of PP continued to increase.
In terms of the driving factors for imports and exports, domestic import volume is mostly based on the stable import of some high-end products, while export volume mostly needs to consider whether the export arbitrage window is open. In February, coinciding with the Chinese New Year holiday, the market trading was temporarily stagnant, with few import offers and high prices, making actual transactions difficult. Therefore, the import quantity was relatively low. In contrast, in terms of exports, overseas market trading continued, and the market was influenced by the Red Sea incident. Against the backdrop of weak domestic market and strong overseas market, the export window remained open, leading to an increase in export volume. In March, domestic spot prices did not show a significant rise, remaining relatively low globally, and the export window continued to stay open.
Trading partner | Export volume(kt) | Export value (USD) | Growth(kt) |
Vietnam | 46.5 | 50427277 | 30.1 |
Brazil | 25.7 | 24999086 | 15.2 |
Bangladesh | 22.4 | 21597665 | 14.1 |
Peru | 17.3 | 16654271 | 11.4 |
Thailand | 14.6 | 14988917 | 6.3 |
India | 14.3 | 13845579 | -3.4 |
Pakistan | 12.3 | 11980821 | 5 |
Nigeria | 10.8 | 11332175 | 9 |
Kenya | 10.3 | 10319018 | 6.5 |
Philippines | 9.3 | 9820892 | 3.3 |
Indonesia | 9.2 | 9638315 | -14.2 |
Mexico | 9 | 10362875 | 5.8 |
Colombia | 8.6 | 8420765 | 4.9 |
Ecuador | 8.3 | 7892445 | 5.6 |
Guatemala | 5.6 | 5389229 | 2.8 |
Others | 65.1 | 74173453 | |
Total | 289.3 | 301842783 |
In the structure of PP exports, homo PP accounts for over 90%. Seeing from the figure above, it can be observed that most countries and regions have shown various degrees of increase. In terms of absolute quantity, Vietnam has shown the highest increase, followed by Brazil and Bangladesh. In terms of percentage increase, among the top trading partners in terms of absolute quantity, Nigeria has experienced the largest increase, nearly 500%. Apart from increases, there has been a noticeable decrease in exports to Indonesia.