Export
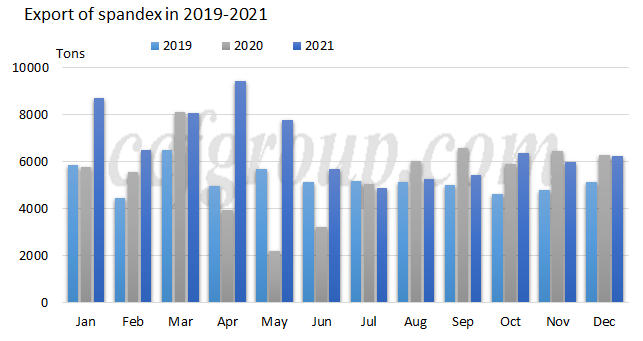
According to the statistics from China Customs, export of spandex under Hs code: 54024410 amounted to 80.4kt in 2021, up 23.4% or 15,217 tons on the year, and the average export unit price was at US$8.715/kg, a y-o-y increase of US$3.872/kg.

Export of spandex by quarter
Exports of spandex hit historic high in 2021, with high monthly export volume in the first half of year but falling quantity from Jul while slightly recovering in Q4 with ample supply. Spandex exports surged by 19.9% on the year to 23.3kt in the first quarter, hiked by 144% on annual basis to 22.9kt in Q2 and declined by 11.8% year on year to 15.6kt in Q3, the second highest level in Q3 in recent 5 years. Exports of spandex shrank by above 1% over last year in Q4 as exports were high at same period of last year, the exchange rate of RMB appreciated against USD, the sea freight was high and supply of containers was tight. However, domestic supply of spandex was ample in China and suppliers were active in exporting. Exports of spandex still rose on the quarter.
| Exports of spandex in 2021 by quarter (Unit: tons) | |||
| Quarter | 2021 | 2020 | YOY change |
| Q1 | 23,309 | 19,443 | 19.90% |
| Q2 | 22,880 | 9,377 | 144.00% |
| Q3 | 15,586 | 17,670 | -11.80% |
| Q4 | 18,575 | 18,644 | -0.40% |
| 2021 | 80,350 | 65,134 | 23.40% |
Export of spandex by destinations
| Nation | Quantity | YOY change | Proportion |
| Turkey | 17117 | 63.80% | 21.30% |
| Taiwan, China | 6037 | 57.70% | 7.50% |
| Egypt | 5290 | 28.70% | 6.60% |
| South Korea | 4999 | 8.50% | 6.20% |
Turkey remained the biggest export destination in 2021. Exports of spandex to Turkey, South Korea and Egypt still accounted for above 40% of the total. Exports to Columbia, Turkey, Bangladesh, Taiwan of China, and India all rose by 41%-114% on the year in 2021.
| Export of spandex by destination in 2021 | |||||
| Destination | Quantity/kg | Proportion | Value/USD | Average price/US$/kg | YOY change/kg |
| Turkey | 17,116,983 | 21.30% | 160,405,811 | 9.371 | 6,669,003 |
| Taiwan China | 6,036,716 | 7.50% | 57,336,629 | 9.498 | 2,207,771 |
| Egypt | 5,290,223 | 6.60% | 51,766,607 | 9.785 | 1,180,881 |
| South Korea | 4,998,660 | 6.20% | 36,639,457 | 7.33 | 392,760 |
| Vietnam | 4,834,454 | 6.00% | 41,266,612 | 8.536 | -751,587 |
| Columbia | 4,279,769 | 5.30% | 37,778,652 | 8.827 | 2,280,748 |
| Bangladesh | 3,998,353 | 5.00% | 39,291,806 | 9.827 | 1,192,528 |
| Brazil | 3,961,512 | 4.90% | 28,823,099 | 7.276 | -1,607,699 |
| Pakistan | 3,743,278 | 4.70% | 33,782,849 | 9.025 | 329,690 |
| India | 2,314,316 | 2.90% | 17,431,234 | 7.532 | 673,119 |
| Other | 23,776,056 | 29.60% | 195,742,198 | 8.233 | 2,649,333 |
| Total | 80,350,320 | 100% | 700,264,954 | 8.715 | 15,216,547 |
Export of spandex by origins
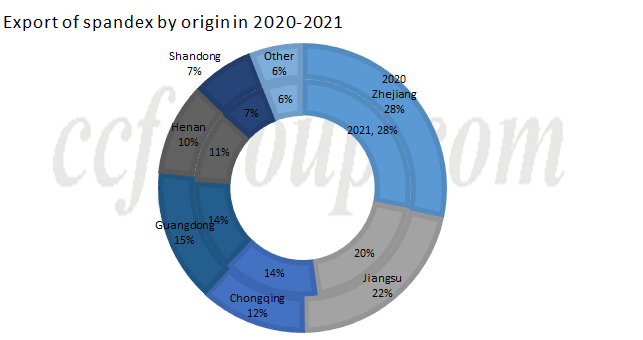
Zhejiang, Jiangsu, Guangdong, Chongqing, Henan and Shandong were major export suppliers of spandex in 2021, occupying 94.05% totally, basically flatting with the corresponding period of last year. Proportion of Zhejiang, Jiangsu and Guangdong all declined on the year, while that of Chongqing, Henan and Shandong advanced by 3.3 percentage points over last year.

Exports of spandex by terms of trade
Ordinary trade was major term of trade according to the data from China customs, accounting for around 90% of the total. Export by processing and assembling accounted for above 10% and export by other trade term was very small.
| Exports of spandex by terms of trade in 2020-2021 | ||
| Terms of trade | 2021 | 2020 |
| Ordinary trade | 86.84% | 83.86% |
| Processing with Imported Materials | 12.89% | 15.97% |
| Others | 0.14% | 0.10% |
| Trade of processing with customer's materials | 0.08% | 0.02% |
| Inbound and Outbound Goods in Bonded Supervision Area | 0.03% | 0.02% |
| Petty trade in the border areas | 0.02% | 0.04% |
| Total | 100% | 100% |
Import
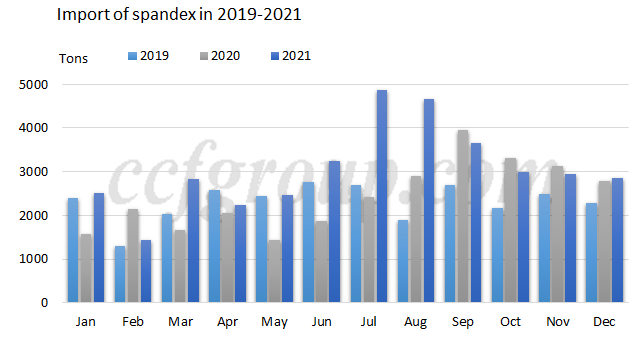
Import of spandex totaled 36.7kt in 2021, a year-on-year increase of 25.4% or 7428 tons and the average import unit price was at US$10.199/kg, up by US$4.197/kg on annual basis. The net export of spandex was at 43.7kt.

Import of spandex by quarter
Monthly imports of spandex largely hit multi-year high in 2021, except for some months impacted by the dull season and holiday issue. Import of spandex scored at 6,787 tons in Q1, up by 25.7% year on year with recovering demand for textiles and apparels both domestically and abroad. In Q2, supply of spandex sustained tight supported by booming demand. Imports of spandex obviously climbed up to near 8,000 tons in Q2, up by 48% on annual basis and hitting quarterly new high. In Q3, a large quantity of spandex from Vietnam and India arrived in China, with spandex imports up by 42.1% on the year to above 13kt. Demand for spandex was not dull during off-season and supply of spandex kept tight. Import unit price obviously climbed up on the quarter. In Q4, imports of spandex decreased by 4.8% on annual basis as production recovered outside China, domestic supply increased and the imports were high in the fourth quarter of 2020.
Import of spandex by origin
| Import of spandex by origin in 2021 | ||||
| Origin | Quantity (kg) | Proportion | Unit price ($/kg) | YOY change (kg) |
| Vietnam | 16,472,385 | 44.90% | 9.983 | 925,201 |
| South Korea | 6,187,606 | 16.90% | 9.798 | 2,791,685 |
| Singapore | 5,763,796 | 15.70% | 10.842 | 1,012,430 |
| Japan | 2,923,821 | 8.00% | 13.29 | 1,008,335 |
| India | 1,782,421 | 4.90% | 9.989 | 1,526,845 |
| Thailand | 1,626,345 | 4.40% | 9.273 | 442,161 |
| UK | 1,348,825 | 3.70% | 7.689 | -5,748 |
| Others | 590,397 | 1.60% | 7.733 | -273,044 |
| Total | 36,695,596 | 100.00% | 10.199 | 7,427,865 |
Imports of spandex mainly came from Vietnam, South Korea, Singapore, Japan and India in 2021 and moved up, with those from South Korea, India, Singapore and Japan up by more than 1,000 tons. Vietnam was the biggest import origin, accounting for near 45%, and South Korea was the second largest supplier, up by above 90% on the year to 6,187 tons, taking up 16.9% of the total. Imports from Singapore rose by 21.3% to 5,764 tons, occupying 15.7% of the total. Imports of spandex from Vietnam, Singapore and South Korea occupied 77.5% of the total.
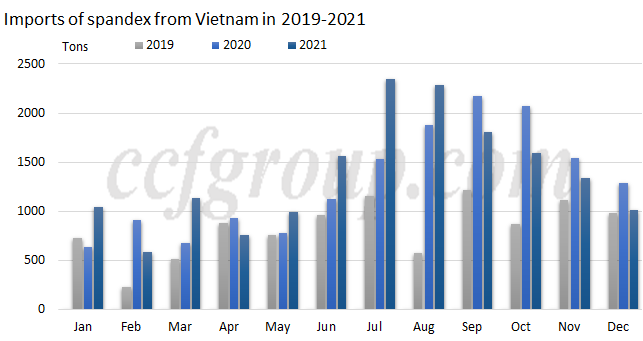
Vietnam remained the biggest import origin from 2014 to 2021. Imports from Vietnam increased by 6% to 16.5kt in 2021, which rose by above 60% during the same period of last year. Imports from Vietnam gradually moved up month by month in April-July, mainly around 757-2,346 tons, but inched down after August while remained high. Domestic demand for spandex was hot in 2021 in China, while the recovery of textiles and apparels was slower in some emerging markets. Some foreign companies increased selling spandex to China.

Import of spandex by unit price
As for the average import price, price of spandex from Japan and Singapore was apparently higher than market average as most were high-end resources. Price of imported spandex from Vietnam, India, South Korea, Thailand, UK, Malaysia and Philippines was lower than the average import unit price.